
The Economy Grew 3.4% Last Quarter, Which Is Great News for Everyone Who Can Afford Eggs

Desk: Economic, Business & Financial, Macroeconomics
Byline: Dakota Jones
Date: October 29, 2026
The headline is strong. The household math is less tidy.
The U.S. economy grew at a 3.4% annualized rate in the third quarter, according to the Bureau of Economic Analysis’ advance estimate released Thursday. That is up from 2.2% in the second quarter and ahead of forecasts.
It is a strong headline. It is not, by itself, a household budget.
The same morning, the BEA reported that the personal consumption expenditures (PCE) price index rose 3.6% year over year in September, up from 3.4% in August. Core PCE inflation, which excludes food and energy, was 3.1%.
So, yes: output is growing faster. And yes: prices are still rising, with the headline PCE rate moving higher. Both facts fit in the same news report. Neither cancels the other out, despite the persistent temptation to treat one encouraging statistic as a receipt for everyone’s financial comfort.
For voters thinking about rent, groceries, utilities, and the rest of the monthly tab, the 3.4% figure may sound less like a victory lap and more like a number from someone else’s spreadsheet.
The verdict: The economy is growing quickly. That does not mean every household feels richer, or that the cost-of-living squeeze has eased.
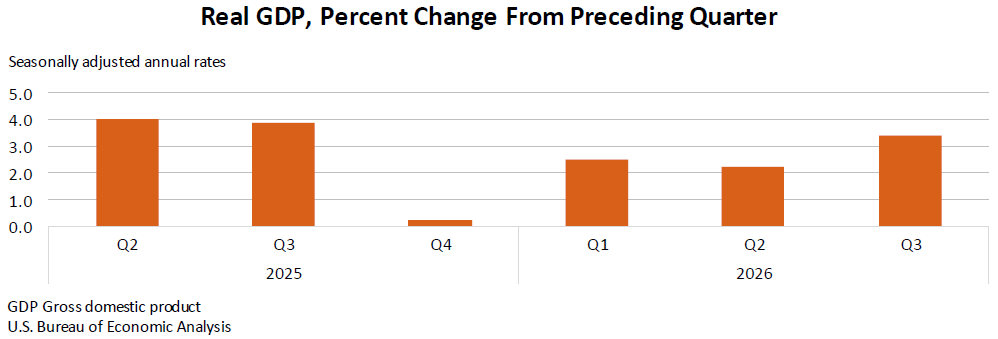
Graphic: Real GDP growth. The BEA’s Q3 figure is an advance estimate, expressed at an annualized rate.
First, what does “3.4% growth” actually mean?
Here is what you’ll learn in this section: what the GDP number measures, why it is annualized, and why it is useful, but not a direct report on your checking account.
Gross domestic product (GDP) measures the value of goods and services produced in the United States. “Real” GDP adjusts for price changes, helping distinguish growth in production from growth that reflects prices alone.
The 3.4% figure is an annualized rate. In plain English, it takes the quarter’s pace and expresses what that pace would look like over a year if it continued. It does not mean the economy’s total output jumped 3.4% from July to September. Nor does it describe how much an individual worker’s pay rose, how much a family spent, or whether the grocery bill became less painful.
The quarterly comparison is still useful. Real GDP grew at a 2.2% annualized rate in Q2, then 3.4% in Q3. That is an acceleration. A stronger pace of economic activity can signal resilience in production and demand. It is worth reporting clearly.
But an economy-wide measure is not a universal report card. GDP can rise while some people struggle to keep up with costs. It can also rise while other households and businesses benefit from the expansion. The aggregate number tells you the direction and pace of total output; it does not tell you how evenly the gains are distributed.
That distinction matters, especially when the campaign conversation is centered on affordability. If the economic headline says “growth” but your own essential bills keep taking a bigger bite, you do not need a lecture about the difference between a national statistic and a household budget. You are already living it.
What drove the stronger quarter?
The advance estimate points to consumer spending and investment as important contributors to Q3 growth. Government spending also increased, while a decrease in exports partly offset the gains. Imports rose; in the calculation of GDP, imports are subtracted.
Business investment in artificial intelligence infrastructure is also a significant part of the current growth story. Investment in the equipment and systems needed to build out AI capabilities can support economic activity well beyond the companies at the center of the technology boom. It can shape spending on equipment, facilities, and related services.
That does not mean every AI investment will pay off. It does not mean every business will adopt the technology successfully. And it does not mean AI infrastructure explains every tenth of the 3.4% number. It does mean that investment in the sector is one of the forces helping define this expansion.
Consumer spending is another central piece. When households continue to buy goods and services, that demand can support businesses and overall output. But spending totals need context. Spending more does not necessarily mean consumers are buying substantially more. Prices can raise the amount households pay even when the quantity they purchase changes little.
That is why growth and affordability can diverge. The economy may register robust activity while households continue to feel stretched. “People are spending” and “people feel comfortable spending” are not interchangeable statements.

AI infrastructure investment is part of the business-investment story. This image is illustrative.
Inflation has not taken the hint from the GDP headline
Now for the less celebratory part. September PCE inflation was 3.6% year over year, compared with 3.4% in August. Core PCE, the measure that excludes food and energy, was 3.1%.
Inflation measures how quickly prices are rising over time. A rate of 3.6% does not mean every price rose by 3.6%. It is an index-wide measure, and the experience of an individual household depends on what that household buys.
It also does not mean prices fell when inflation slows. A lower inflation rate usually means prices are rising more slowly, not that they have returned to earlier levels. That difference is easy to miss in an abstract chart and hard to ignore at the checkout.
The title’s eggs are a shorthand for that very ordinary frustration. This report does not provide a specific figure for egg prices, and no egg-price claim is needed to make the broader point. Many households measure affordability through the things they have to buy, not through an economy-wide output statistic.
The PCE index is important because it is a key inflation measure followed by policymakers. But it is not a personalized cost-of-living calculator. Your household’s experience can differ according to spending patterns, location, income, and the costs you cannot easily avoid.
That’s the gap in today’s news: GDP describes the pace of economic production; inflation describes how prices are changing; neither number alone tells you whether your own finances feel manageable.
Why the Fed is watching both sides of the story
The GDP and inflation figures arrive just after the Federal Reserve held interest rates on October 28. Two dissenters wanted a rate hike. That puts the competing signals in sharp focus: economic growth is strong, while the latest year-over-year PCE inflation reading moved higher.
The Federal Reserve uses interest rates as one tool to influence financial conditions and, over time, inflation and demand. Higher rates can make borrowing more expensive for households and businesses. Lower rates can make borrowing cheaper. Neither move offers an instant fix, and the effects do not land evenly across the economy.
A strong growth number might normally sound like a reason for policymakers to be cautious about easing financial conditions. Rising inflation can add to that caution. But the policy debate is not a mechanical switch where one number dictates the next move. The Fed weighs a wider set of evidence and faces the challenge of balancing inflation against economic activity.
Thursday’s reports help explain why that debate is difficult. The economy is growing. Inflation is also running higher by the September year-over-year measure than it did in August. Policymakers have to interpret both signals, not select the one that makes for the cleaner headline.
And interest-rate choices matter well beyond financial markets. They affect borrowing conditions across the economy, including for people considering a home purchase, carrying debt, or financing business investment. But it would be too simple to say a particular rate decision will quickly solve the costs households are facing. Monetary policy takes time to work, and it is not a direct substitute for measures that address specific household expenses.
For consumers and businesses, the practical takeaway is not to treat one GDP release as a forecast for rates, prices, or the next quarter. One report can change the conversation without settling it.
A strong national number, five days before Election Day
The timing is hard to miss. This release lands five days before the November 3 midterm elections, with affordability a central campaign theme. Polls show voters’ cost-of-living anxiety far outpacing the headline growth numbers.
That does not make the GDP estimate less real. It does help explain why its political reception may be muted. A national growth statistic and a voter’s financial experience operate at different scales. One summarizes activity across an entire economy. The other shows up in recurring bills and difficult decisions about what can wait.
For campaigns, a 3.4% growth rate is an attractive statistic. For voters, it may prompt a fair follow-up: “What does that mean for my household?” There is no single answer in the GDP release.
A credible account of the economy should resist both easy narratives. Calling the quarter an unqualified success ignores rising inflation and persistent affordability concerns. Calling growth meaningless ignores a real acceleration in output. The accurate story is more complicated, and more useful:
- Real GDP accelerated from 2.2% in Q2 to 3.4% in Q3.
- The September PCE inflation rate rose to 3.6% year over year, from 3.4% in August.
- Core PCE inflation was 3.1%.
- The Fed held rates on October 28, with two dissenters favoring a hike.
- Voters remain focused on cost-of-living pressures, not just the national growth rate.
For readers around Rockville and Washington, D.C., where LD3 Productions is based, the national figures are still only a starting point. The economic experience of an individual household or local business depends on its own costs and income. That is one reason responsible coverage should explain what a statistic measures, what it leaves out, and why it matters. Learn more about LD3’s Trust-First approach to journalism.
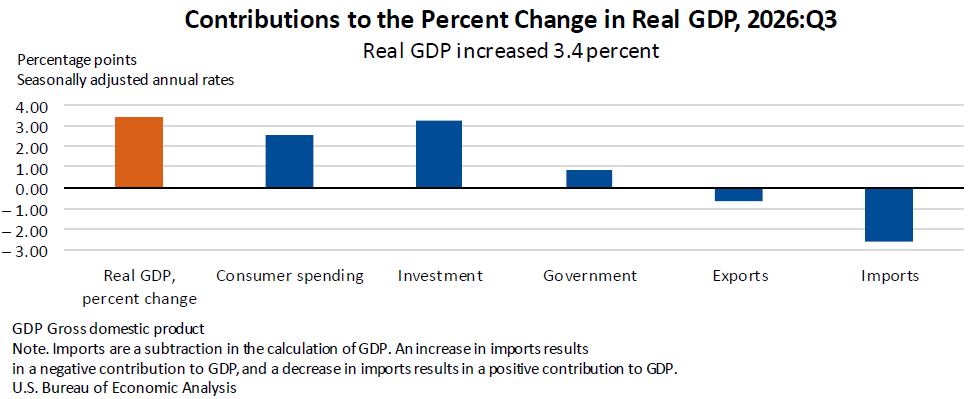
Graphic: Contributions to real GDP growth, from the BEA’s advance estimate.
What to watch next
Here is what you can take from the release without pretending it answers every question.
- Treat the GDP figure as an early estimate. The BEA calls this the advance estimate. It is the first estimate, not the final word. The agency’s next release of Q3 GDP is scheduled for November 25, 2026.
- Keep growth and inflation separate. They describe different aspects of the economy. Stronger output does not mean prices stopped rising.
- Look at the trend, not a single report. One quarter’s annualized growth rate is a snapshot of pace, not a guarantee that the same pace will continue.
- Pay attention to household affordability. National data can provide context, but your budget depends on your own income and spending. An economy-wide index cannot tell you how much room you have after essentials.
- Watch how policymakers respond to mixed signals. The latest data helps frame the Fed’s debate; it does not reveal the outcome of future decisions.

Local businesses and households experience the economy through their own costs and demand.
FAQ: What the numbers do, and don’t, say
Did the U.S. economy grow 3.4% in the third quarter?
Real GDP grew at a 3.4% annualized rate, according to the BEA’s advance estimate for Q3 2026. The annualized figure expresses the quarter’s pace as if it continued for a year; it is not a 3.4% increase from Q2 to Q3.
Was growth faster than in the previous quarter?
Yes. Real GDP grew at a 2.2% annualized rate in Q2 and a 3.4% rate in Q3.
Does faster GDP growth mean prices are going down?
No. GDP growth measures economic output. Inflation measures changes in prices. The September PCE price index rose 3.6% year over year, up from 3.4% in August.
What was core PCE inflation?
3.1% year over year in September. Core PCE excludes food and energy prices.
Does 3.6% inflation mean every household’s costs rose by 3.6%?
No. It is an index-wide measure. Individual experiences differ according to what people buy and where their costs are concentrated.
Does the GDP report prove that households are better off?
No. It shows strong aggregate growth, not how much a particular household earns, spends, or can afford. The GDP result and voters’ cost-of-living concerns can both be true.
Final thoughts: strong growth is not a household budget
The Q3 number is genuinely strong. The move from 2.2% to 3.4% deserves to be reported plainly. So does the increase in year-over-year PCE inflation to 3.6%, the 3.1% core reading, and the Fed’s rate decision the day before.
The useful conclusion is not that the headline is fake, or that the headline settles the affordability debate. It is that economic growth and household comfort are related, but they are not the same measure.
As the election approaches and policymakers weigh mixed signals, look beyond the biggest number in the graphic. Ask what the statistic measures, what it does not measure, and whether it describes the part of the economy you want to understand.
And if the economy is growing but your grocery run still feels expensive, the data does not require you to pretend otherwise.
Sources: